Embark on a journey into the fascinating world of data variability with our comprehensive guide to Calculator Coefficient of Variation. This powerful tool empowers you to decipher the hidden patterns within your data, enabling informed decision-making and unlocking valuable insights.
Delve into the intricacies of CV calculations, unraveling its formula and components. Discover the art of interpreting CV results, deciphering their significance and limitations, and explore the diverse applications of CV across various industries.
Coefficient of Variation (CV) Calculation and Interpretation
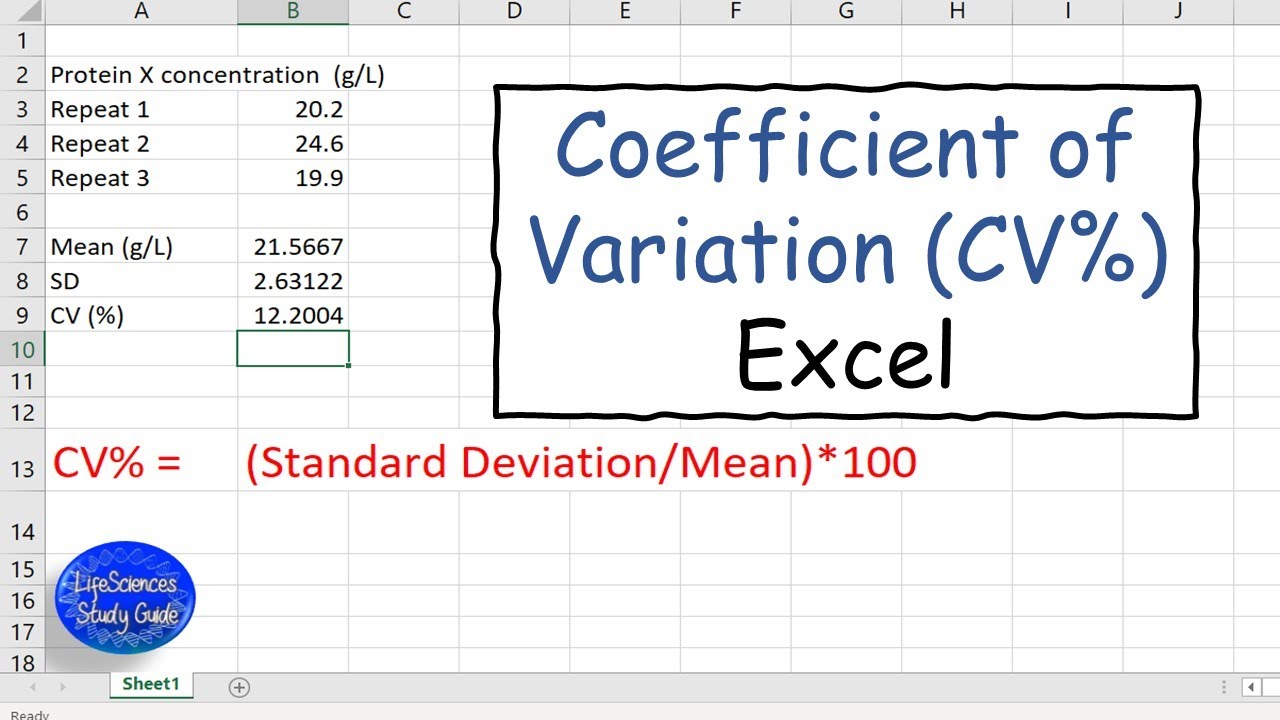
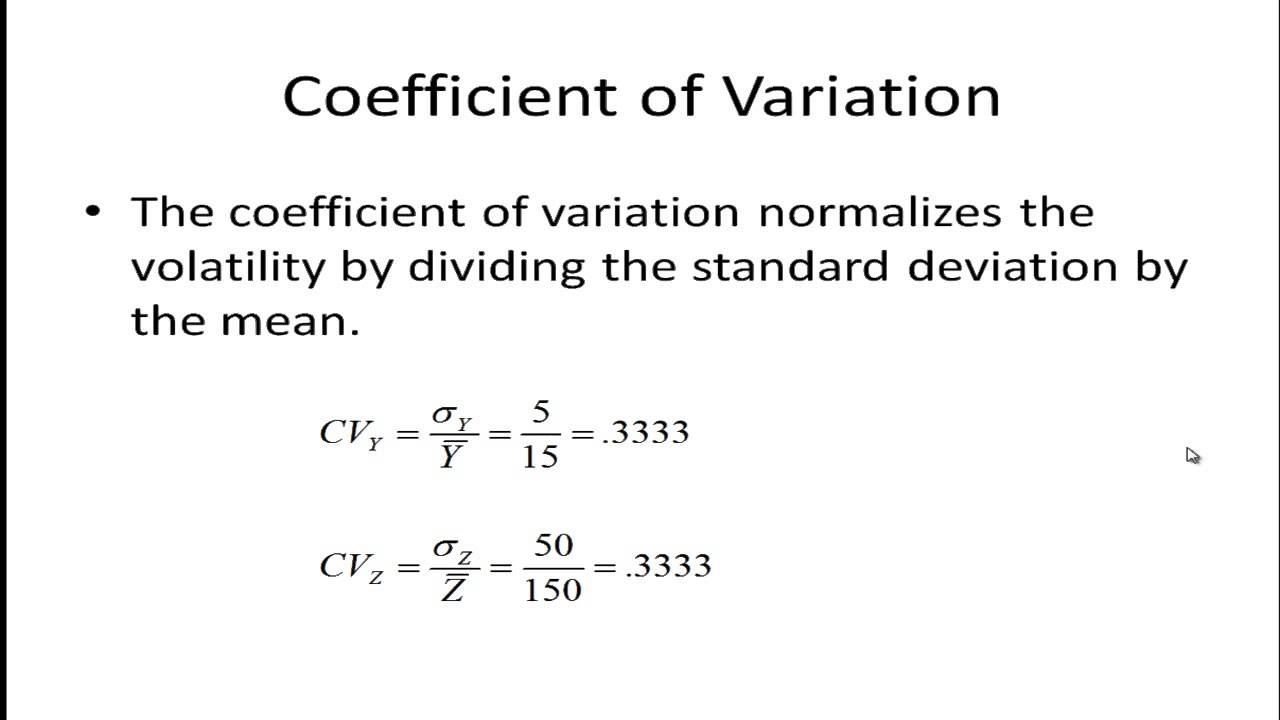
The coefficient of variation (CV) is a statistical measure that quantifies the relative variability of a data set. It is calculated by dividing the standard deviation of the data by its mean and multiplying the result by 100 to express it as a percentage.
The formula for CV is:
CV = (Standard deviation / Mean) x 100
The CV can be interpreted as a measure of the dispersion of the data around the mean. A higher CV indicates greater variability, while a lower CV indicates less variability.
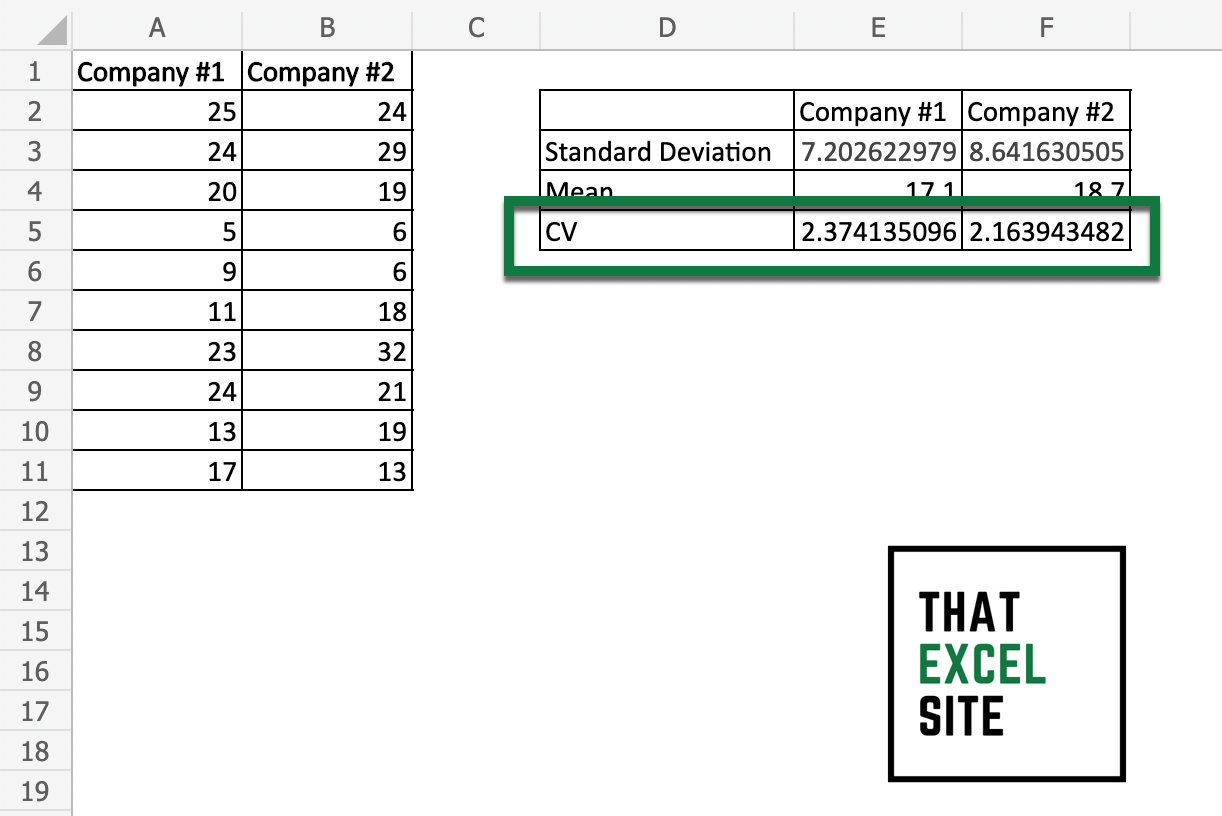
The CV is a useful tool for comparing the variability of different data sets, even if they have different means. It is also useful for identifying outliers, which are data points that are significantly different from the rest of the data.
Limitations of CV
The CV has some limitations. It is not a measure of absolute variability, but rather a measure of relative variability. This means that the CV can be affected by the scale of the data.
For example, if two data sets have the same standard deviation, but one data set has a higher mean, the data set with the higher mean will have a lower CV.
Another limitation of the CV is that it can be affected by the presence of outliers. Outliers can increase the standard deviation of a data set, which can lead to a higher CV.
Applications of CV in Data Analysis

The coefficient of variation (CV) is a versatile metric that finds applications across diverse fields, providing valuable insights into data variability and aiding informed decision-making.
Finance
In finance, CV is used to assess the risk associated with investments. A higher CV indicates greater variability in returns, implying higher risk. Investors use CV to compare the risk-return profiles of different assets and make informed decisions about portfolio allocation.
Healthcare
In healthcare, CV is used to evaluate the effectiveness of medical treatments. A lower CV suggests that a treatment produces more consistent outcomes, while a higher CV indicates greater variability in patient responses. This information helps healthcare professionals make evidence-based decisions about treatment selection and patient management.
Manufacturing
In manufacturing, CV is used to monitor and improve production processes. A higher CV in product dimensions or quality measurements indicates variability in the manufacturing process. By analyzing CV, manufacturers can identify areas for improvement and implement measures to reduce process variation, leading to increased product quality and efficiency.
Advantages of Using CV
- Provides a standardized measure of variability, allowing for easy comparison across different datasets.
- Helps identify outliers and extreme values, which can skew the interpretation of data.
- Facilitates risk assessment and decision-making by quantifying data variability.
Disadvantages of Using CV, Calculator coefficient of variation
- Can be misleading if the data is not normally distributed.
- May not be appropriate for comparing datasets with different means.
- Does not provide information about the direction of variability (i.e., whether the data is increasing or decreasing).
Factors Influencing CV Values
The Coefficient of Variation (CV) is a measure of relative variability that can be affected by various factors. Understanding these factors is crucial for interpreting CV results accurately and mitigating their impact on calculations.
Sample Size
Sample size significantly influences CV values. Larger sample sizes generally result in lower CVs, as they provide a more representative sample of the population. Smaller sample sizes, on the other hand, can lead to higher CVs due to sampling error.
Data Distribution
The distribution of data can also impact CV values. CVs are typically higher for data with a wider range and more extreme values. Conversely, data with a narrower range and fewer outliers will have lower CVs.
Outliers
Outliers, which are extreme values that deviate significantly from the rest of the data, can have a substantial effect on CV calculations. Outliers can artificially inflate or deflate CV values, making them less representative of the true variability in the data.
Mitigating the Impact of Factors on CV Calculations
To mitigate the impact of these factors on CV calculations, consider the following strategies:
- Ensure a sufficiently large sample size to reduce sampling error.
- Examine the distribution of data to identify any potential outliers or extreme values.
- Consider removing outliers or transforming the data to reduce their influence on CV calculations.
Comparison of CV with Other Variability Measures: Calculator Coefficient Of Variation
The coefficient of variation (CV) is a standardized measure of dispersion that allows for the comparison of variability across different data sets, regardless of their units of measurement. However, it is not the only measure of variability available. Other commonly used measures include range, interquartile range, and standard deviation.Each
of these measures has its own strengths and weaknesses, and the choice of which measure to use depends on the specific context and the goals of the analysis.
Range
The range is the simplest measure of variability and is calculated as the difference between the maximum and minimum values in a data set. It is easy to calculate and interpret, but it can be sensitive to outliers.
Interquartile Range
The interquartile range (IQR) is a more robust measure of variability than the range and is calculated as the difference between the 75th and 25th percentiles. It is less sensitive to outliers than the range, but it can be more difficult to interpret.
Standard Deviation
The standard deviation is a measure of variability that is based on the average distance of the data points from the mean. It is a more sophisticated measure of variability than the range or IQR, but it can be more difficult to interpret.
When to Use CV
The CV is most appropriate to use when comparing variability across different data sets that have different units of measurement. For example, if you are comparing the variability of heights of two different groups of people, you would use the CV because it would allow you to compare the variability of the two groups, even though they are measured in different units (e.g.,
inches and centimeters).
Final Conclusion
As we conclude our exploration of Calculator Coefficient of Variation, remember its versatility as a data analysis tool. Its ability to quantify variability and guide decision-making makes it an invaluable asset for data-driven professionals. Embrace the power of CV to unlock the secrets of your data and empower your organization with informed insights.