The Stem and Leaf Display Calculator is an indispensable tool for data analysis, providing a clear and concise representation of data distribution. By organizing data into stems and leaves, this calculator simplifies the identification of patterns, trends, and outliers, making it an invaluable asset for researchers, statisticians, and students alike.
In this comprehensive guide, we will delve into the construction, analysis, and applications of stem and leaf displays, exploring the benefits of using calculators for this purpose and uncovering advanced applications in statistical modeling. Join us as we unlock the power of data visualization with the Stem and Leaf Display Calculator.
Stem and Leaf Display Construction

Stem-and-leaf displays are a type of data visualization that is used to organize and display numerical data. They are particularly useful for data that is not normally distributed or that has a large number of outliers.
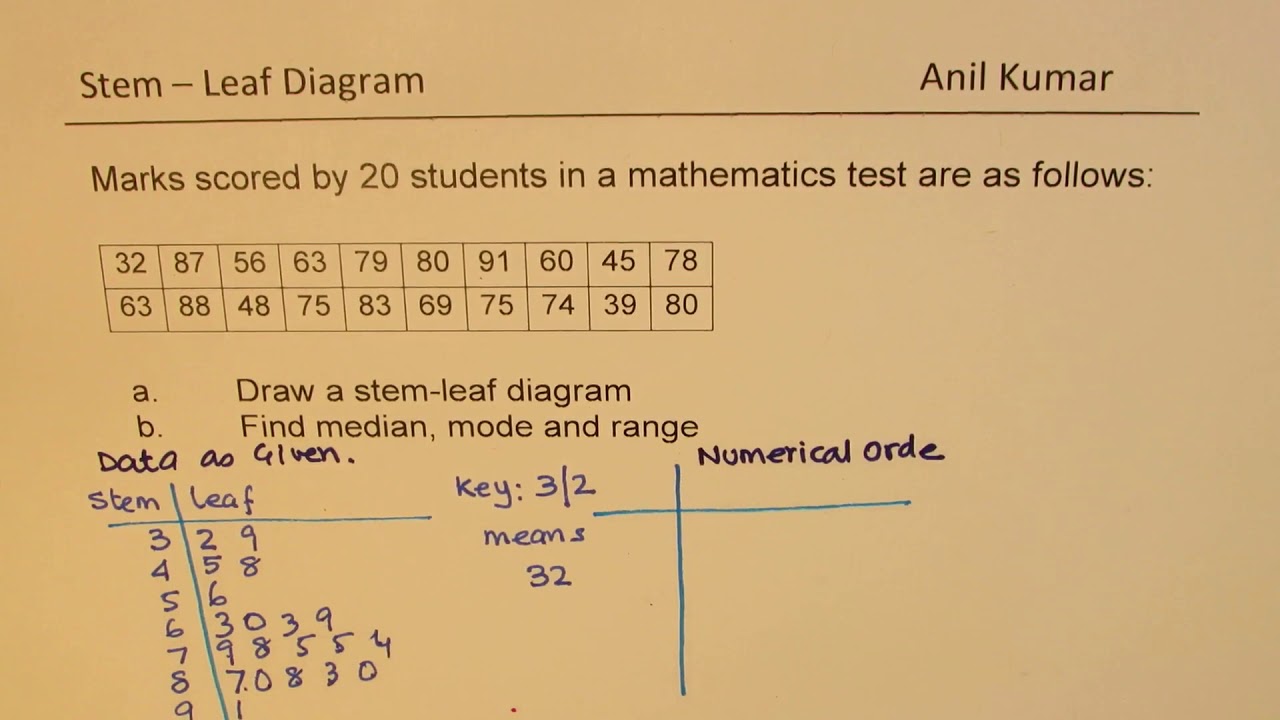
To construct a stem-and-leaf display, you first need to sort the data in ascending order. Then, you need to separate each number into two parts: the stem and the leaf. The stem is the first digit of the number, and the leaf is the remaining digits.
Creating a Stem-and-Leaf Display
- Sort the data in ascending order.
- Separate each number into a stem and a leaf.
- Create a table with the stems in the left-hand column and the leaves in the right-hand column.
- Draw a line between the stems and the leaves.
The stem-and-leaf display can then be used to find the median, mode, and range of the data. It can also be used to identify outliers.
Stem and Leaf Display Analysis

Stem-and-leaf displays provide a graphical representation of data that allows for easy analysis of its distribution. By examining the arrangement of the stems and leaves, we can identify outliers, patterns, and trends within the dataset.
Identifying Outliers
Outliers are extreme values that deviate significantly from the rest of the data. To identify outliers, we compare the values in the stem-and-leaf display to the overall distribution. Values that fall outside the expected range or are isolated from the main body of the data are considered outliers.
Examining Patterns
Stem-and-leaf displays can reveal patterns in the data. For example, if the leaves are evenly distributed across the stems, it suggests a uniform distribution. If the leaves are concentrated in certain stems, it may indicate a skewed distribution. Additionally, gaps or clusters in the display can highlight potential modes or gaps in the data.
Detecting Trends
Trends refer to gradual changes in the data over time or across different categories. By comparing stem-and-leaf displays created for different time periods or groups, we can identify trends such as increases, decreases, or fluctuations in the data.
Calculator Applications
Calculators can greatly simplify the construction of stem-and-leaf displays. They automate the process of sorting and organizing data, saving time and reducing the risk of errors. Furthermore, calculators can handle large datasets efficiently, making them suitable for analyzing extensive datasets.
Online Calculators
- Stem-and-Leaf Display Calculator: https://www.calculator.net/stem-and-leaf-plot-calculator.html
- Stem and Leaf Plot Generator: https://www.socscistatistics.com/descriptive/stemleaf.aspx
- StatKey: https://www.lock5stat.com/statkey/StemandLeaf.aspx
Software Calculators
- Microsoft Excel:Use the STEM.PLOT() function to create stem-and-leaf displays.
- SPSS:Use the STEMLEAF command to create stem-and-leaf displays.
- Minitab:Use the Stem-and-Leaf command to create stem-and-leaf displays.
Advanced Applications: Stem And Leaf Display Calculator

Stem-and-leaf displays extend beyond basic data organization and visualization. They play a crucial role in statistical modeling, enabling researchers to make inferences and draw conclusions about data.
Statistical Modeling
Stem-and-leaf displays facilitate the construction of frequency distributions, which are essential for statistical modeling. By examining the shape and spread of the distribution, researchers can identify patterns and trends in the data. This information helps them develop statistical models that accurately represent the underlying data-generating process.
Drawing Inferences, Stem and leaf display calculator
Stem-and-leaf displays allow researchers to make inferences about the population from which the data was drawn. By examining the median, quartiles, and other measures of central tendency and variability, they can estimate population parameters and draw conclusions about the distribution of the data.
This information is valuable for making predictions and generalizing findings to a larger population.
Last Word
In conclusion, the Stem and Leaf Display Calculator is a powerful tool that empowers users to analyze data with ease and efficiency. Its ability to reveal patterns, trends, and outliers makes it an essential tool for data exploration and statistical modeling.
Whether you are a researcher, statistician, or student, the Stem and Leaf Display Calculator is an invaluable asset that will enhance your understanding of data and unlock new insights.