Step into the realm of data analysis with the 5 Number Summary Calculator, an indispensable tool that empowers you to dissect and comprehend complex datasets with remarkable ease. This calculator serves as your statistical guide, unlocking the secrets of data distribution and providing invaluable insights into the central tendencies and variability within your data.
Unleash the potential of the 5 Number Summary Calculator to uncover hidden patterns, identify outliers, and make informed decisions based on data-driven evidence. Dive into the captivating world of statistical exploration, where numbers come alive and reveal the hidden stories within your data.
Overview of the 5-Number Summary Calculator
The 5-number summary calculator is an online tool that provides a concise overview of the distribution of a dataset. It calculates five key statistical measures: minimum, first quartile (Q1), median, third quartile (Q3), and maximum. These values collectively provide a comprehensive understanding of the central tendency, spread, and potential outliers within the data.
The 5-number summary is particularly valuable in data analysis as it offers a quick and informative snapshot of the dataset’s characteristics. It helps identify patterns, trends, and potential areas of concern, making it an essential tool for data exploration and analysis.
Examples of Datasets where the 5-Number Summary is Useful
- Test scores:The 5-number summary can provide insights into the distribution of test scores, highlighting the range, median performance, and potential outliers.
- Financial data:Analyzing financial data, such as stock prices or sales figures, using the 5-number summary can reveal trends, identify extreme values, and assess overall performance.
- Survey responses:The 5-number summary can summarize survey responses, indicating the central tendency and variability of opinions or preferences.
Methods for Calculating the 5-Number Summary
Calculating the 5-number summary involves a series of steps that can be performed manually or using statistical software. Here, we’ll explore the manual calculation methods.
Step 1: Sorting the Data
The first step is to sort the data set in ascending order, arranging the values from the smallest to the largest.
Step 2: Finding the Median
The median is the middle value of the sorted data set. If there is an even number of values, the median is the average of the two middle values.
Step 3: Finding the Quartiles
The first quartile (Q1) is the median of the lower half of the sorted data set, while the third quartile (Q3) is the median of the upper half of the sorted data set.
Step 4: Finding the Minimum and Maximum
The minimum is the smallest value in the sorted data set, while the maximum is the largest value.
Formula and Equations
The following formulas and equations are used in the calculation:
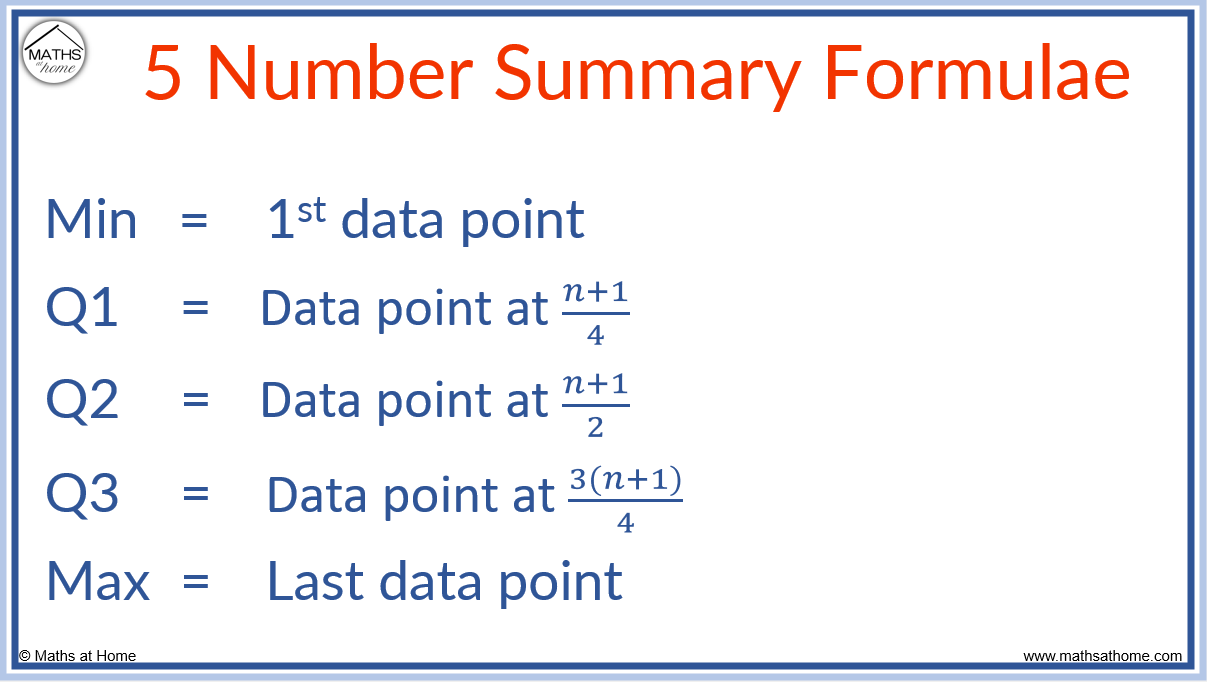
- Median = (n+1)/2th value
- Q1 = (n+1)/4th value
- Q3 = 3(n+1)/4th value
- Minimum = Smallest value in the sorted data set
- Maximum = Largest value in the sorted data set
Flowchart
The following flowchart illustrates the calculation process:
- Start
- Sort the data set in ascending order
- Find the median
- Find the first quartile (Q1)
- Find the third quartile (Q3)
- Find the minimum
- Find the maximum
- End
Applications of the 5-Number Summary Calculator

The 5-number summary calculator finds applications in various fields, aiding in data analysis and interpretation. It provides a concise representation of data distribution, enabling users to quickly identify key characteristics and make informed decisions.
In statistics, the 5-number summary is crucial for understanding data variability and central tendency. By calculating the minimum, maximum, median, Q1, and Q3, researchers can assess the spread and shape of a distribution, identify outliers, and compare multiple datasets.
Data Analysis in Different Contexts
- Healthcare:In medical research, the 5-number summary helps analyze patient data, such as blood pressure or cholesterol levels, to identify trends, monitor progress, and detect potential health risks.
- Education:Educators use the calculator to analyze student performance, compare test scores, and identify areas where students need additional support.
- Finance:In the financial industry, the 5-number summary is used to analyze stock prices, investment returns, and risk profiles, providing insights for informed decision-making.
Identifying Outliers and Trends
The 5-number summary calculator plays a crucial role in identifying outliers, which are data points that significantly deviate from the rest of the dataset. By comparing the minimum and maximum values to the median, users can quickly spot outliers and investigate their potential causes.
Additionally, the calculator helps identify trends in data over time. By analyzing the median and quartiles, users can track changes in data distribution and assess whether the changes are statistically significant.
Advantages and Limitations of the Calculator
The 5-number summary calculator offers several advantages for data analysis. Its user-friendly interface simplifies the calculation process, making it accessible to individuals with varying levels of statistical expertise. The calculator’s automated calculations eliminate the risk of human error, ensuring accuracy and consistency in the results.
Advantages
- Ease of Use:The calculator’s intuitive design allows users to input data and obtain results with minimal effort.
- Accuracy and Reliability:Automated calculations minimize errors, providing dependable results.
- Time-Saving:The calculator automates the calculation process, freeing up time for more complex analysis.
- Visual Representation:The calculator often includes graphical representations of the data, such as box plots, providing a clear visual representation of the results.
Limitations, 5 number summary calculator
Despite its advantages, the 5-number summary calculator also has certain limitations. The calculator’s output is limited to the 5-number summary, which may not provide a comprehensive understanding of the data distribution. Additionally, the calculator does not offer advanced statistical analysis capabilities, such as hypothesis testing or regression analysis.
In comparison to other methods of data analysis, the 5-number summary calculator offers a basic level of analysis. For more comprehensive data analysis, statistical software packages or consultation with a statistician may be required.
Summary: 5 Number Summary Calculator
As we conclude our exploration of the 5 Number Summary Calculator, it’s evident that this tool is a data analysis powerhouse. Its ability to condense vast datasets into concise summaries, identify trends and outliers, and provide a comprehensive understanding of data distribution makes it an invaluable asset for researchers, analysts, and anyone seeking to extract meaningful insights from their data.
Embrace the power of statistical analysis and let the 5 Number Summary Calculator guide you towards data-driven decision-making.